


Bun 支持 WebKit Inspector Protocol,因此您可以使用交互式调试器调试您的代码。为了演示目的,请考虑以下简单的 Web 服务器。
调试 JavaScript 和 TypeScript
Bun.serve({
  fetch(req){
    console.log(req.url);
    return new Response("Hello, world!");
  }
})
--inspect
要在使用 Bun 运行代码时启用调试,请使用 --inspect 标志。这将自动在可用端口上启动一个 WebSocket 服务器,用于内省正在运行的 Bun 进程。
bun --inspect server.ts------------------ Bun Inspector ------------------
Listening at:
ws://:6499/0tqxs9exrgrm
Inspect in browser:
https://debug.bun.sh/#localhost:6499/0tqxs9exrgrm
------------------ Bun Inspector --------------------inspect-brk
--inspect-brk 标志的行为与 --inspect 完全相同,只是它会自动在执行脚本的第一行注入一个断点。这对于调试快速运行并立即退出的脚本很有用。
--inspect-wait
--inspect-wait 标志的行为与 --inspect 完全相同,只是代码在调试器连接到正在运行的进程之前不会执行。
为调试器设置端口或 URL
无论您使用哪个标志,您都可以选择指定端口号、URL 前缀或两者。
bun --inspect=4000 server.tsbun --inspect=localhost:4000 server.tsbun --inspect=localhost:4000/prefix server.ts调试器
各种调试工具都可以连接到此服务器以提供交互式调试体验。
debug.bun.sh
Bun 在 debug.bun.sh 上托管了一个基于 Web 的调试器。它是 WebKit Web Inspector Interface 的修改版本,Safari 用户会觉得很熟悉。
在浏览器中打开提供的 debug.bun.sh URL 以开始调试会话。通过此界面,您将能够查看正在运行的文件的源代码、查看和设置断点,以及使用内置控制台执行代码。
让我们设置一个断点。导航到“源”选项卡;您应该会看到之前的代码。单击行号 3,在我们的 console.log(req.url) 语句上设置一个断点。
然后,在您的网络浏览器中访问 https://:3000。这将向我们的 localhost 网络服务器发送一个 HTTP 请求。页面似乎没有加载。为什么?因为程序在之前设置的断点处暂停了执行。
请注意 UI 的变化。
此时,我们可以做很多事情来内省当前执行环境。我们可以使用底部的控制台在程序上下文中运行任意代码,完全访问断点处作用域中的变量。
在“源”窗格的右侧,我们可以看到当前作用域中的所有局部变量,并深入查看它们的属性和方法。在这里,我们正在检查 req 变量。
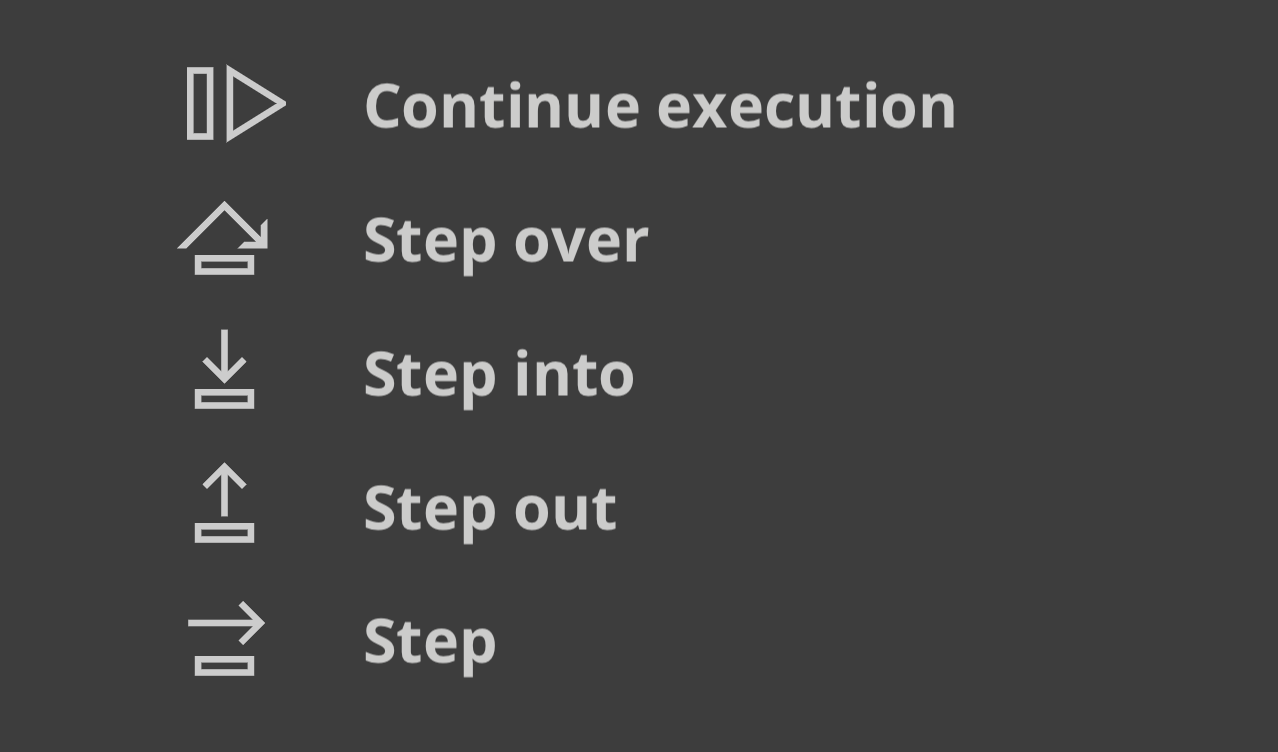
在“源”窗格的左上方,我们可以控制程序的执行。
以下是解释控制流按钮功能的备忘单。
- 继续脚本执行 — 继续运行程序,直到下一个断点或异常。
- 步过 — 程序将继续执行下一行。
- 步入 — 如果当前语句包含函数调用,调试器将“步入”被调用的函数。
- 步出 — 如果当前语句是函数调用,调试器将完成执行该调用,然后“步出”该函数到其被调用的位置。
Visual Studio Code 调试器
Visual Studio Code 中提供了对 Bun 脚本调试的实验性支持。要使用它,您需要安装 Bun VSCode 扩展。
调试网络请求
BUN_CONFIG_VERBOSE_FETCH 环境变量允许您自动记录使用 fetch() 或 node:http 发出的网络请求。
| 值 | 描述 |
|---|---|
curl | 将请求打印为 curl 命令。 |
true | 打印请求和响应信息 |
false | 不打印任何内容。默认值 |
将 fetch 和 node:http 请求打印为 curl 命令
Bun 还支持通过将环境变量 BUN_CONFIG_VERBOSE_FETCH 设置为 curl,将 fetch() 和 node:http 网络请求打印为 curl 命令。
process.env.BUN_CONFIG_VERBOSE_FETCH = "curl";

await fetch("https://example.com", {
  method: "POST",
  headers: {
    "Content-Type": "application/json",
  },
  body: JSON.stringify({ foo: "bar" }),
});
这会将 fetch 请求打印为单行 curl 命令,让您可以复制粘贴到终端中以重现请求。
[fetch] $ curl --http1.1 "https://example.com/" -X POST -H "content-type: application/json" -H "Connection: keep-alive" -H "User-Agent: Bun/1.3.0" -H "Accept: */*" -H "Host: example.com" -H "Accept-Encoding: gzip, deflate, br" --compressed -H "Content-Length: 13" --data-raw "{\"foo\":\"bar\"}"
[fetch] > HTTP/1.1 POST https://example.com/
[fetch] > content-type: application/json
[fetch] > Connection: keep-alive
[fetch] > User-Agent: Bun/1.3.0
[fetch] > Accept: */*
[fetch] > Host: example.com
[fetch] > Accept-Encoding: gzip, deflate, br
[fetch] > Content-Length: 13

[fetch] < 200 OK
[fetch] < Accept-Ranges: bytes
[fetch] < Cache-Control: max-age=604800
[fetch] < Content-Type: text/html; charset=UTF-8
[fetch] < Date: Tue, 18 Jun 2024 05:12:07 GMT
[fetch] < Etag: "3147526947"
[fetch] < Expires: Tue, 25 Jun 2024 05:12:07 GMT
[fetch] < Last-Modified: Thu, 17 Oct 2019 07:18:26 GMT
[fetch] < Server: EOS (vny/044F)
[fetch] < Content-Length: 1256
以 [fetch] > 开头的行是来自本地代码的请求,以 [fetch] < 开头的行是来自远程服务器的响应。
BUN_CONFIG_VERBOSE_FETCH 环境变量在 fetch() 和 node:http 请求中都受支持,因此它应该可以直接工作。
要不带 curl 命令打印,请将 BUN_CONFIG_VERBOSE_FETCH 设置为 true。
process.env.BUN_CONFIG_VERBOSE_FETCH = "true";

await fetch("https://example.com", {
  method: "POST",
  headers: {
    "Content-Type": "application/json",
  },
  body: JSON.stringify({ foo: "bar" }),
});
这会将以下内容打印到控制台
[fetch] > HTTP/1.1 POST https://example.com/
[fetch] > content-type: application/json
[fetch] > Connection: keep-alive
[fetch] > User-Agent: Bun/1.3.0
[fetch] > Accept: */*
[fetch] > Host: example.com
[fetch] > Accept-Encoding: gzip, deflate, br
[fetch] > Content-Length: 13

[fetch] < 200 OK
[fetch] < Accept-Ranges: bytes
[fetch] < Cache-Control: max-age=604800
[fetch] < Content-Type: text/html; charset=UTF-8
[fetch] < Date: Tue, 18 Jun 2024 05:12:07 GMT
[fetch] < Etag: "3147526947"
[fetch] < Expires: Tue, 25 Jun 2024 05:12:07 GMT
[fetch] < Last-Modified: Thu, 17 Oct 2019 07:18:26 GMT
[fetch] < Server: EOS (vny/044F)
[fetch] < Content-Length: 1256
堆栈跟踪和源映射
Bun 会转译每个文件,这听起来可能意味着您在控制台中看到的堆栈跟踪会无用地指向转译输出。为了解决这个问题,Bun 会自动为每个转译的文件生成并提供源映射文件。当您在控制台中看到堆栈跟踪时,您可以单击文件路径并跳转到原始源代码,即使它是用 TypeScript 或 JSX 编写的,或者应用了其他转换。
Bun 会在运行时按需转译文件时以及使用 bun build 提前预编译文件时自动加载源映射。
语法高亮源代码预览
为了帮助调试,当发生未处理的异常或拒绝时,Bun 会自动打印一个小的源代码预览。您可以通过调用 Bun.inspect(error) 来模拟此行为
// Create an error
const err = new Error("Something went wrong");
console.log(Bun.inspect(err, { colors: true }));
这会打印发生错误的源代码的语法高亮预览,以及错误消息和堆栈跟踪。
1 | // Create an error
2 | const err = new Error("Something went wrong");
                ^
error: Something went wrong
      at file.js:2:13
V8 堆栈跟踪
Bun 使用 JavaScriptCore 作为其引擎,但 Node.js 生态系统和 npm 的大部分都期望 V8。JavaScript 引擎在 error.stack 格式方面有所不同。Bun 旨在成为 Node.js 的直接替代品,这意味着我们的任务是确保即使引擎不同,堆栈跟踪也尽可能相似。
这就是为什么当您在 Bun 中记录 error.stack 时,error.stack 的格式与 Node.js 的 V8 引擎中的格式相同。这在使用期望 V8 堆栈跟踪的库时特别有用。
V8 堆栈跟踪 API
Bun 实现了 V8 堆栈跟踪 API,这是一组允许您操作堆栈跟踪的函数。
Error.prepareStackTrace
Error.prepareStackTrace 函数是一个全局函数,允许您自定义堆栈跟踪输出。此函数使用错误对象和 CallSite 对象数组调用,并允许您返回自定义堆栈跟踪。
Error.prepareStackTrace = (err, stack) => {
  return stack.map(callSite => {
    return callSite.getFileName();
  });
};

const err = new Error("Something went wrong");
console.log(err.stack);
// [ "error.js" ]
CallSite 对象具有以下方法
| 方法 | 返回 |
|---|---|
getThis | 函数调用的 this 值 |
getTypeName | this 的类型 |
getFunction | 函数对象 |
getFunctionName | 函数名(字符串) |
getMethodName | 方法名(字符串) |
getFileName | 文件名或 URL |
getLineNumber | 行号 |
getColumnNumber | 列号 |
getEvalOrigin | undefined |
getScriptNameOrSourceURL | 源 URL |
isToplevel | 如果函数在全局作用域中,则返回 true |
isEval | 如果函数是 eval 调用,则返回 true |
isNative | 如果函数是原生函数,则返回 true |
isConstructor | 如果函数是构造函数,则返回 true |
isAsync | 如果函数是 async,则返回 true |
isPromiseAll | 尚未实现。 |
getPromiseIndex | 尚未实现。 |
toString | 返回调用站点的字符串表示 |
在某些情况下,Function 对象可能已被垃圾回收,因此其中一些方法可能返回 undefined。
Error.captureStackTrace(error, startFn)
Error.captureStackTrace 函数允许您在代码中的特定点捕获堆栈跟踪,而不是在抛出错误的点捕获。
当您有回调或异步代码难以确定错误源时,这会很有帮助。Error.captureStackTrace 的第二个参数是您希望堆栈跟踪开始的函数。
例如,下面的代码将使 err.stack 指向调用 fn() 的代码,即使错误是在 myInner 处抛出的。
const fn = () => {
  function myInner() {
    throw err;
  }

  try {
    myInner();
  } catch (err) {
    console.log(err.stack);
    console.log("");
    console.log("-- captureStackTrace --");
    console.log("");
    Error.captureStackTrace(err, fn);
    console.log(err.stack);
  }
};

fn();
这会记录以下内容
Error: here!
    at myInner (file.js:4:15)
    at fn (file.js:8:5)
    at module code (file.js:17:1)
    at moduleEvaluation (native)
    at moduleEvaluation (native)
    at <anonymous> (native)

-- captureStackTrace --

Error: here!
    at module code (file.js:17:1)
    at moduleEvaluation (native)
    at moduleEvaluation (native)
    at <anonymous> (native)